Two years ago, we introduced our more graphical forecast products. This past winter season, we started asking ourselves if we could better display this data in an easier to read and use format. Since trade shows and other events were off the table due to COVID-19, we decided to take a look at what we could do. We surprised ourselves.
Starting this winter season, most of our forecast products will contain a new look and format. Most of the changes were made to the first page of the forecast product, which is now much more organized. We completely overhauled our maps that we use to generate snowfall forecasts, including the colors we use for forecast snowfall. Let’s take a look at some of the changes for each forecast product.
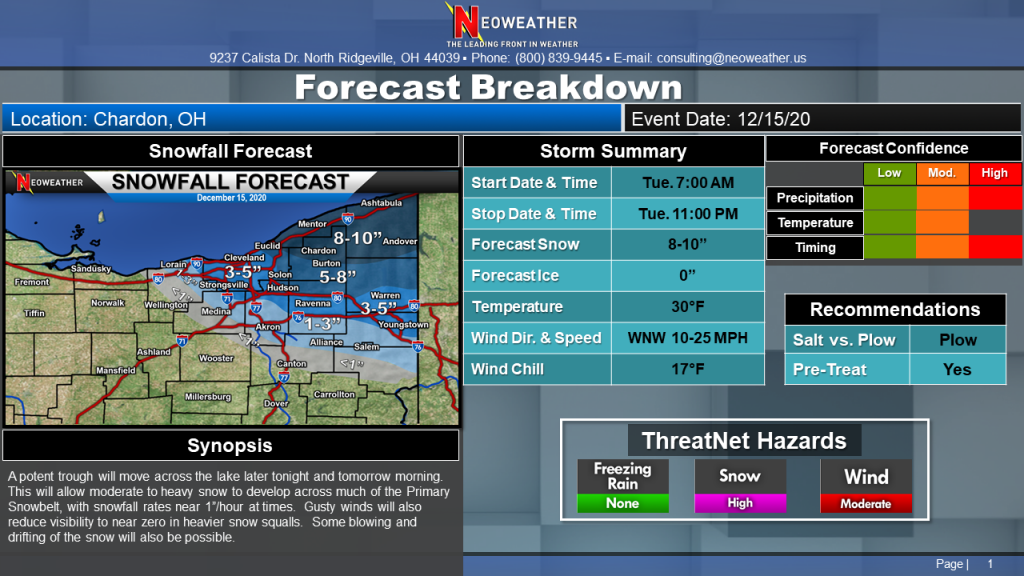
Forecast Breakdown and NEO FirstLook

We designed the first page of each product to look the same on purpose – the NEO FirstLook is our first detailed forecast on an event and is sent 2-3 days prior to the storm impacting your area. The Forecast Breakdown is a revised forecast for your area that also contains more detailed data that allows you to finalize your plans for the event. We typically send this to you within 24 hours of the event starting in your area. Therefore, the following changes are reflected in both products.
Information that was once spread out is now more organized into one general area. We also revised our Forecast Confidence scale to be a little more flexible to account for various event types. We also overhauled our ThreatNet Hazards section to account for the most common winter threats in an easy to view format. We also added a “synopsis” section, which will give you an overview of the event in a few short sentences. The remaining sections of the products remain unchanged.
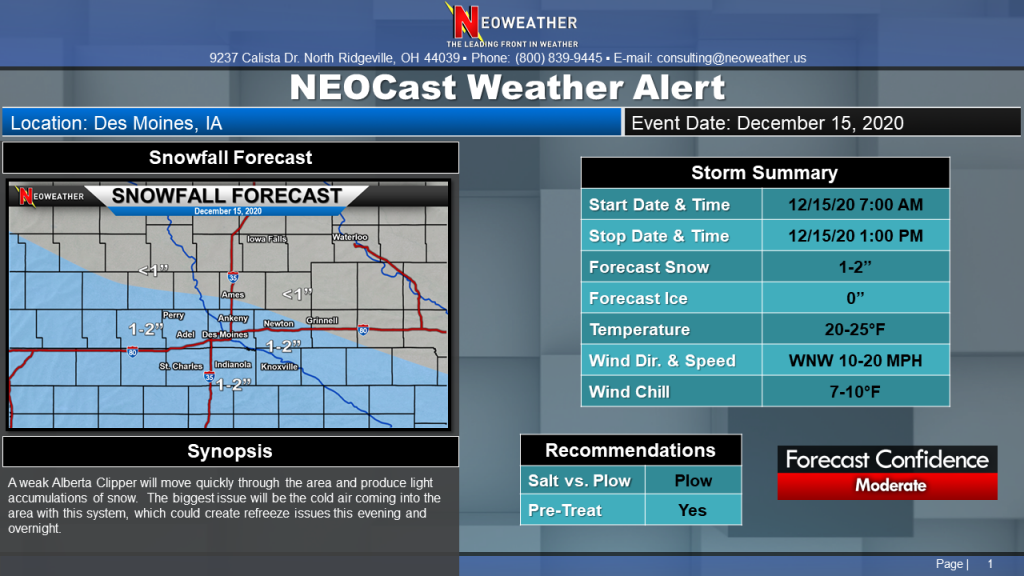
NEOCast Weather Alert

We issue this product for low impact events (snow accumulation of 2” or less and or a light glaze of ice). Following a similar format to the Forecast Breakdown and NEO FirstLook, we have revised it’s layout to be more organized and easier to follow. Our Forecast Confidence section went from a slider presentation to a “Low,” “Medium,” “High” approach for easier dissemination. We also added a synopsis section.
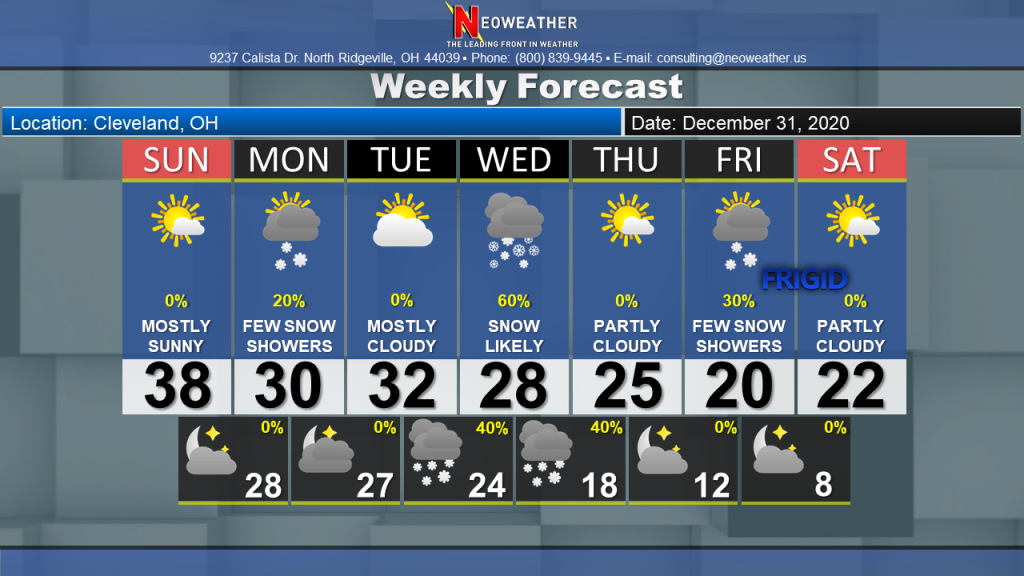
Weekly Forecast

The overall format of the Weekly Forecast remains the same however, you will notice new weather icons on the seven day forecast.
Samples of our Forecast Products
We really think you will enjoy the look of our redesigned products and you can view samples of each clicking on the links below.


